Today, we have chosen the H8 chart which clearly shows the Fibonacci corrective levels for the bearish wave started at 1.31 to the significant low of 0.2818, and this time-frame also gives us an idea about the strength of the recovery started in the 0.2820 areas.
With that in mind, the recent bounce from 61.8% Fibonacci has found a very strong support at 38.2% Fibonacci that intersected with the uptrend line carrying the recovery. Additionally, trend indicator (Parabolic SAR) succeeded in carrying the movements supporting holders and buyers.
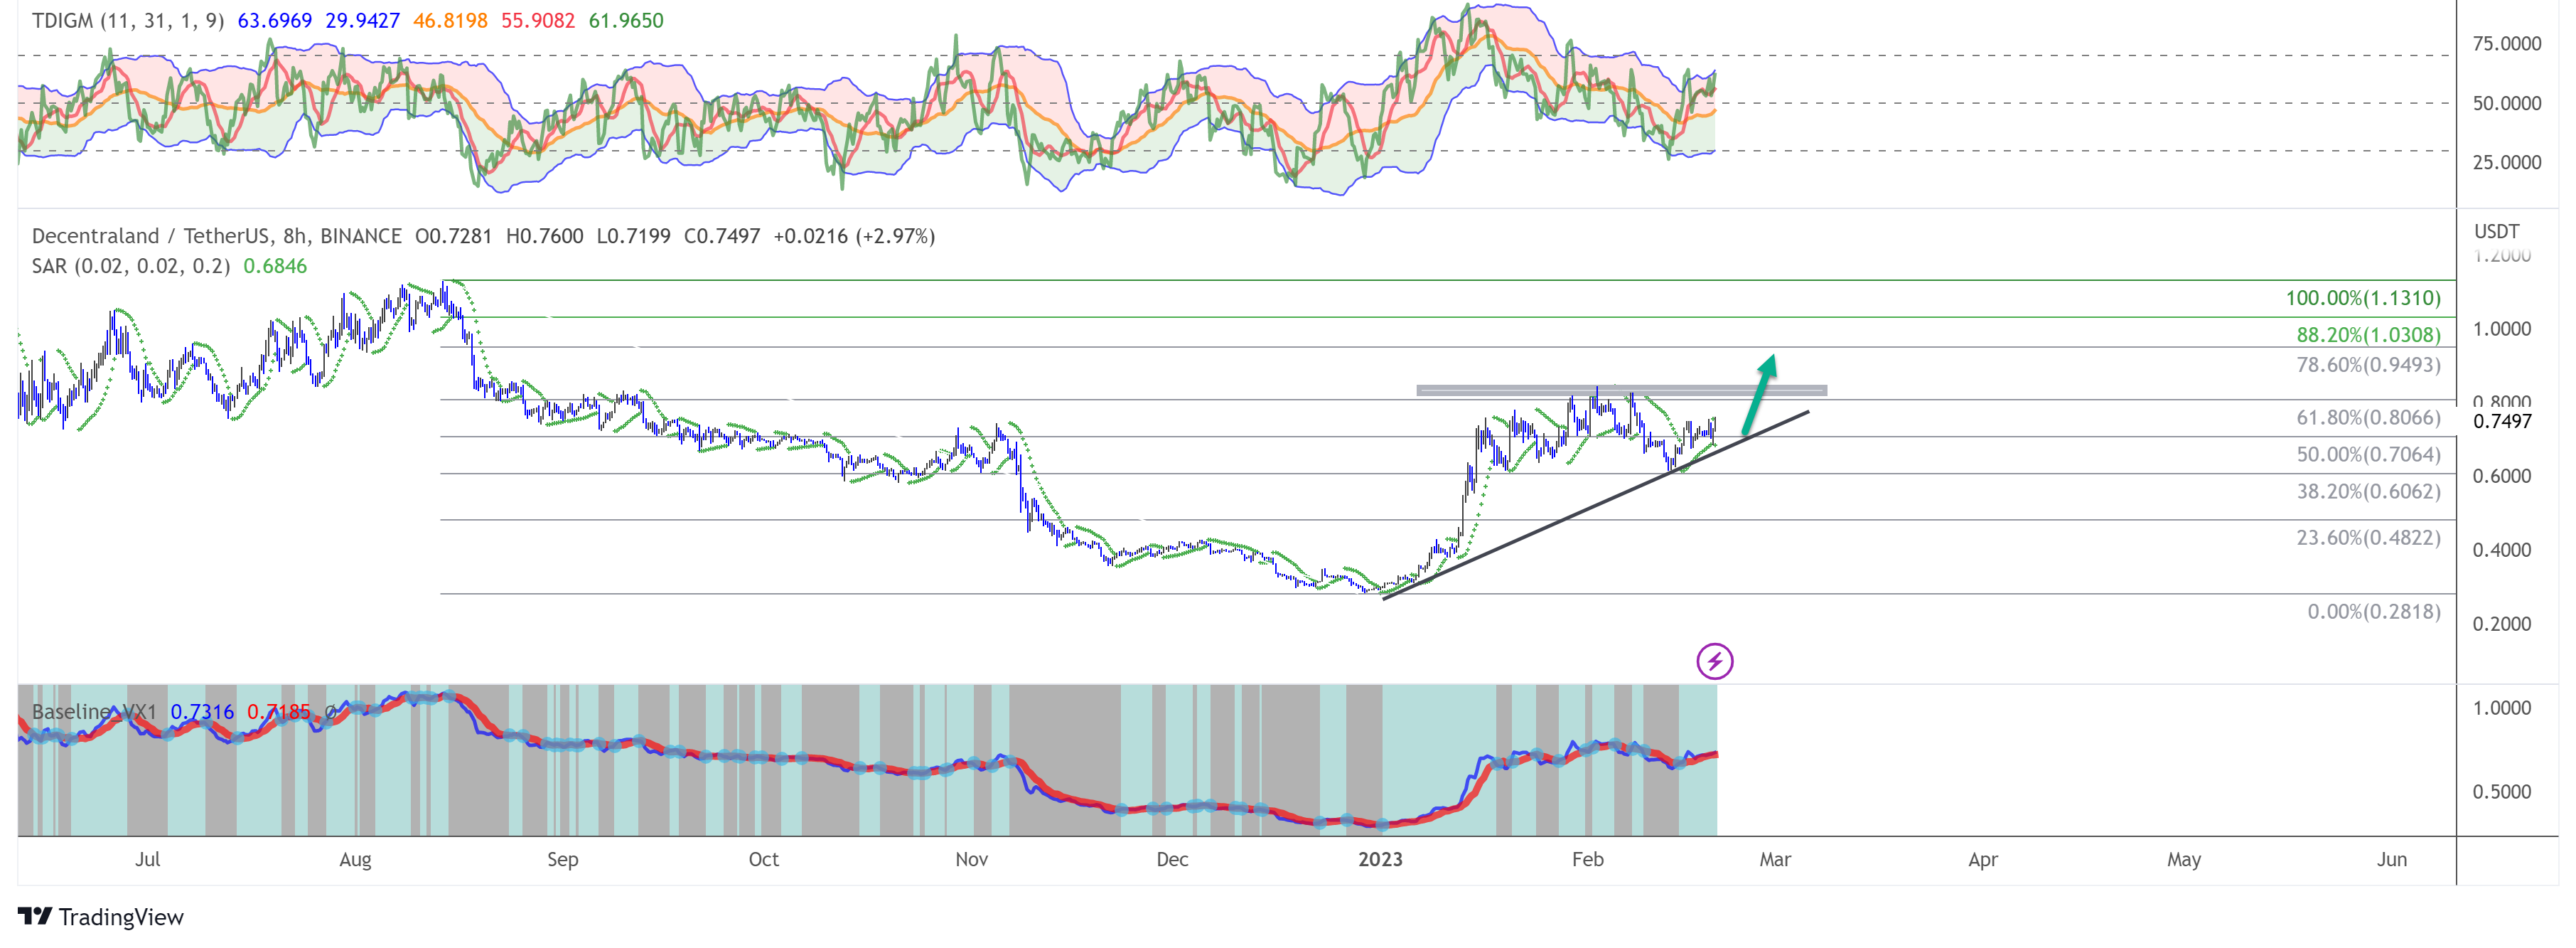
With good positive signals on momentum indicators, we believe that MANA is on the way to hit 61.8% Fibonacci at 0.8066 towards 3 key levels at 0.9490, 1.0308 and 1.3110 respectively.
On the downside, 0.6065 shouldn’t be intact to keep the bullish momentum towards the parity.